

Biodiversity is in the midst of a crisis1 and it is both important to monitor the evolution of wild populations and to disturb them as little as possible. There two seemingly contradictory actions could be reconciled thanks to an increasingly useful source of information: environmental DNA (or eDNA).
Tracking organisms using their DNA
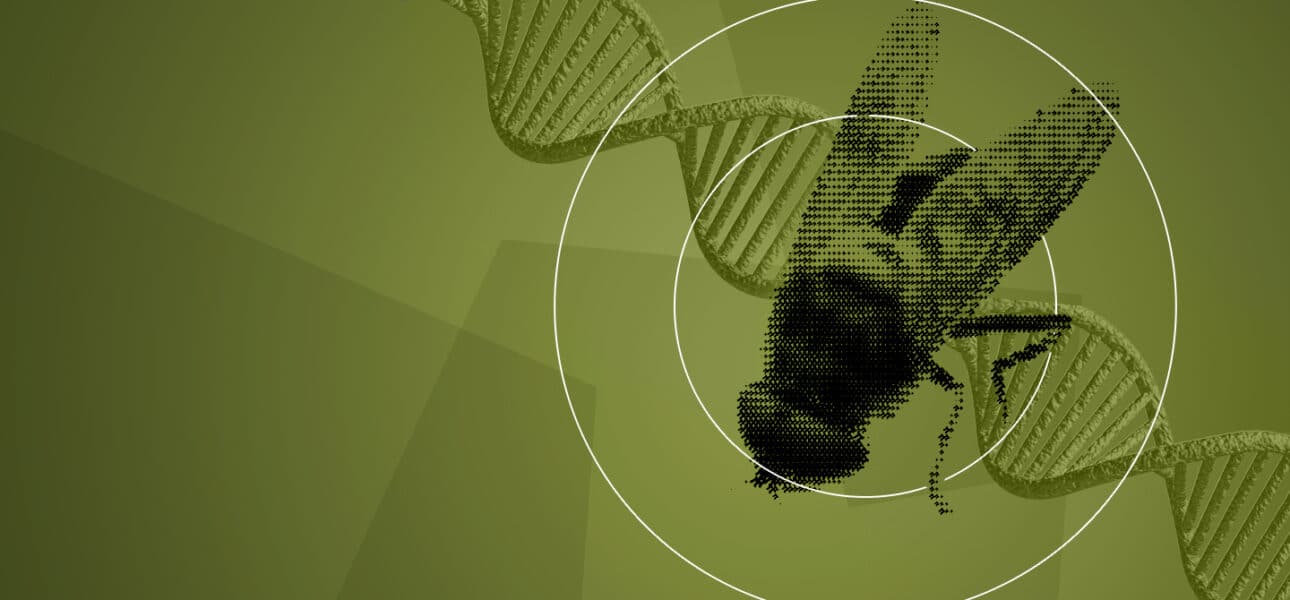
Since the 1980s, samples collected from the environment have made it possible to study the invisible micro-organisms they contain by analysing their genomes. This approach, developed thanks to advances in sequencing techniques and computer tools, gave rise to metagenomics, the large-scale study of genomes.
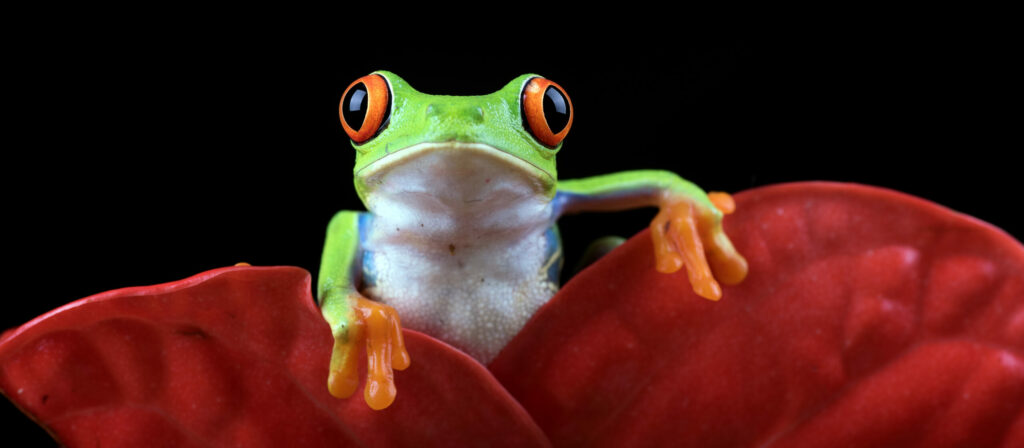
But although micro-organisms are to be found just about everywhere, they are not the only sources of DNA in the environment! Mucus, dead skin, hair, carcasses, faeces… All living beings, whatever their size, leave traces of their passage. And these traces can contain DNA that makes it possible to track their presence, which was demonstrated for the first time in 2008 by a team from the Alpine Ecology Laboratory, which identified the DNA of bullfrogs in various ponds2.
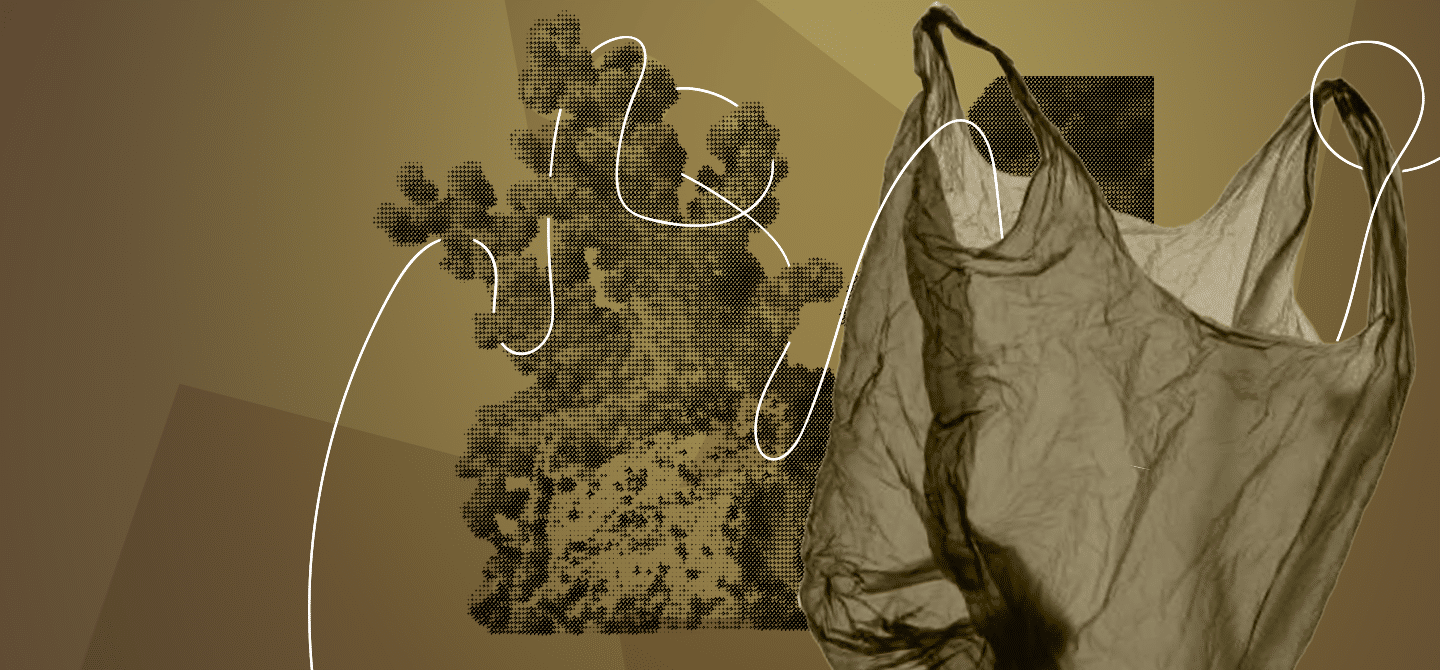
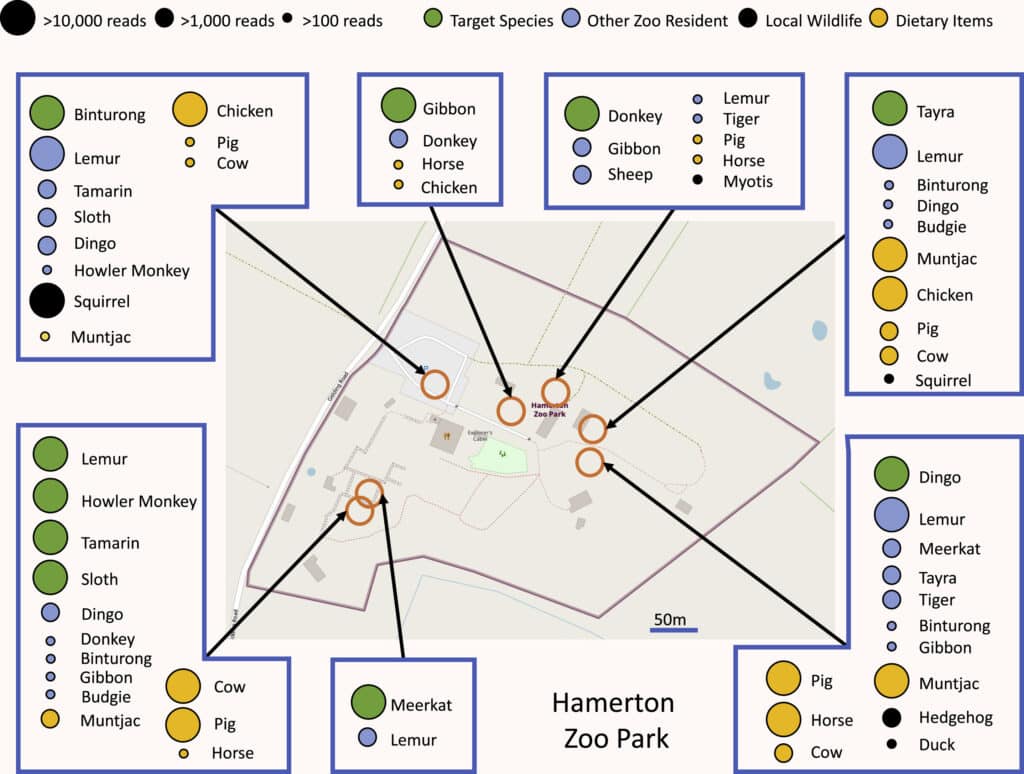
eDNA is therefore also a tool for monitoring populations of macro-organisms, whose effectiveness has been demonstrated in many environments, from sediments to the seabed… and even in the air itself! Two studies published at the beginning of 2022,34 have shown that by sucking air from zoos and analysing its DNA content, it is possible to identify dozens of species of animals living in or near these zoos. This promising approach opens up new possibilities but still has a number of weaknesses. To understand them, we need to look in more detail at how it works.
Making environmental DNA talk
Once recovered from the environment, DNA can be analysed in three ways. The first is to perform global metagenomics, sequencing all the DNA to try to identify as many of the genomes present as possible. This approach is suitable for the study of micro-organisms, which are directly contained in the sample and whose DNA is therefore well preserved and present in large quantities. It is less relevant for macro-organisms, whose DNA is rarer and more damaged in the environment, generally being found in the form of fragments of a few dozen to a few thousand nucleotides long.
The analysis of this type of eDNA relies on the use of molecular barcodes, genetic sequences that identify a species or class of organisms. These must be short enough to be found in naturally fragmented DNA. These “barcode” sequences are specifically amplified by PCR and then sequenced and analysed. They can be more or less specific, making it possible to monitor a single species, a group of closely related species or to make a more extensive inventory of the biodiversity of an environment. Depending on the range chosen, this is known as barcoding or metabarcoding, which is a form of targeted metagenomics.
The analysis is then based on the comparison of the barcodes obtained with those listed in databases. These databases are more or less well populated depending on the field and this is one of the weak points of eDNA studies: the richer the databases, the less limited the analyses. The accumulation of new data is gradually changing the situation!
Strengths and weaknesses of environmental DNA
Currently, eDNA has four main types of application: the study of biodiversity (cataloguing of species, monitoring over time, analysis of biological functions5, etc.); the targeted monitoring of certain species (particularly threatened, invasive or bioindicator species6); the estimation of the relative abundance of species in a given environment; and the reconstruction of diets by analysing the DNA contained in excrement7.
In some environments, such as sediments and very cold environments, eDNA is preserved for long periods of time, making it possible to go back in time. For example, researchers have studied unicellulars from the Brest harbour over a period of 1,400 years, highlighting the impact of the Second World War and recent changes in agricultural practices8. The record for the use of eDNA in palaeoecology was broken at the beginning of December thanks to permafrost samples from Greenland, which made it possible to reconstruct a palaeoecosystem of about two million years9!
eDNA also has many advantages for the study of present-day species. Indeed, its collection is non-invasive, which avoids disturbing the environments studied, and very simple. The corresponding fieldwork requires little equipment and training, allows access to places unsuitable for direct observations, can be easily grafted onto expeditions already planned elsewhere and remains decoupled from the analysis work. It is much less costly and restrictive than conventional observation methods, allows for more sampling and opens up possibilities for monitoring on a large spatiotemporal scale. Analytical methods also lend themselves to this expansion, as pooling the processing of many samples generates economies of scale.
In some environments, such as sediments and very cold environments, eDNA is preserved for long periods of time, making it possible to go back in time.
As promising as it is, however, the use of eDNA has its limitations. To begin with, and this is fundamental even if it seems obvious, detecting an individual’s DNA is not the same as detecting their presence. It does not tell us anything about its state of health, size, or stage of development, all of which are only accessible through direct observation. It does not necessarily tell us where it is, either, as DNA can be transported in the environment! In rivers, species can leave traces several kilometres downstream from their actual position.
Moreover, not all organisms release DNA in a comparable way into their environment and, depending on the fragility of the structure containing the DNA and the conditions of the environment (in particular pH and temperature), eDNA can be degraded more or less rapidly. The absence of DNA does not necessarily mean the absence of a species. Conversely, DNA can easily contaminate samples, whether it comes from the experimenters and their equipment or from another source. For example, restaurants or markets in coastal areas can lead to the detection of eDNA from non-living fish10.
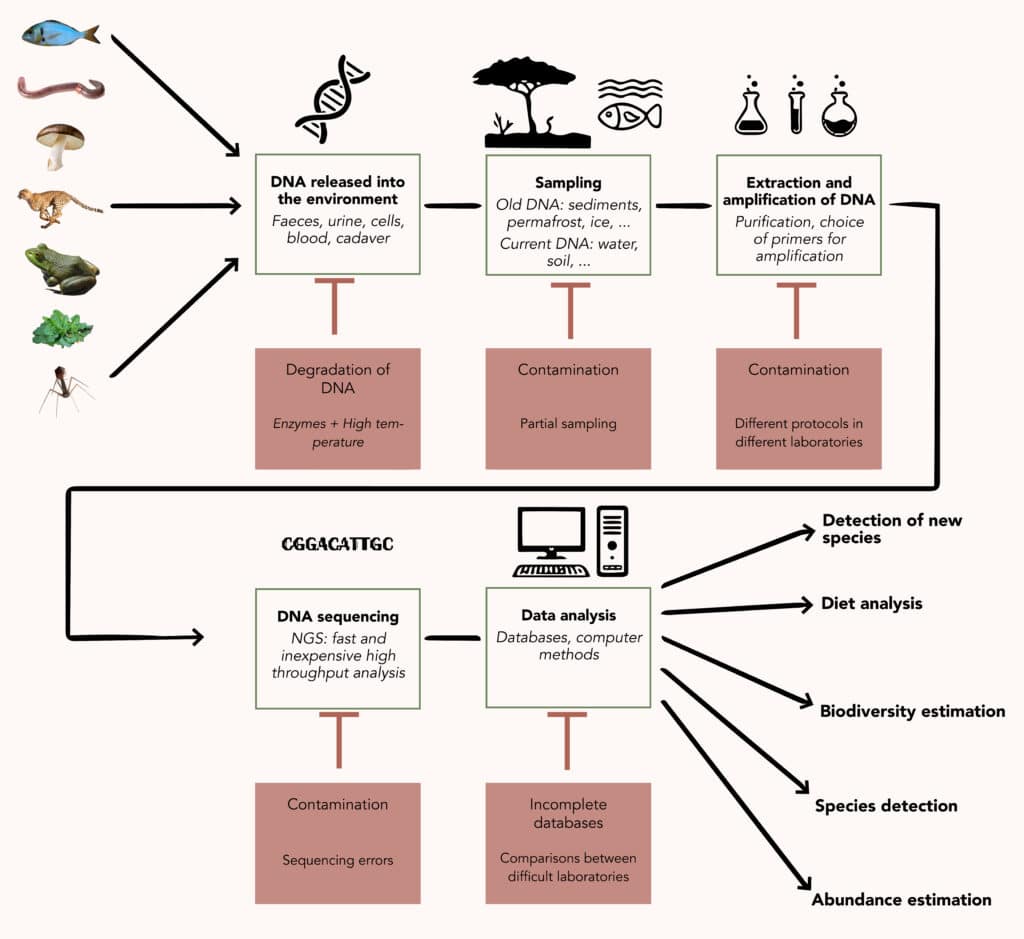
Finally, biomolecular and computer processing techniques generate their own biases. Beyond the incompleteness of the databases, PCR amplification is not equally efficient on all DNA sequences and, depending on the barcodes chosen and the way they are detected, false negatives or false positives may appear, which is difficult to monitor on a case-by-case basis in large-scale analyses. This variability in amplification, together with sampling bias, limits the suitability of eDNA as a quantification tool. Each study of this type requires meticulous checks to ensure that the results obtained via eDNA are comparable to those obtained by manual counting. The final icing on the cake of complications is that the sequencing itself can be a source of error.
Solving these technical problems is a central issue for teams interested in eDNA. Several research projects aim to reduce the uncertainties of analysis, notably by standardising protocols, populating databases and identifying relevant molecular barcodes12, which bodes well for future improvements.
As Sam Chew Chin, a PhD student studying fish populations via eDNA, puts it, this tool can be seen as a genetic nose – a new way of smelling the biosphere. It cannot detect everything perfectly, but it opens up possibilities that, combined with other approaches, can only improve our understanding of biodiversity.