Why we need to decarbonise freight transport, and how

- Transport is the main CO2-emitting sector: it accounted for 31% of French greenhouse gas emissions in 2019.
- Between 1960 and 2017, CO2 emissions from freight transport increased 3.3 times.
- The national low-carbon strategy has generated 5 actions to taken in order to decarbonise transport of goods, such as moderating transport demand.
- The objective is to move away from oil by 2050, which accounts for 90% of the sector's energy consumption.
- If a break with current trends is not made, the share of freight transport in transport emissions could increase further.
Freight transport: 10% of French emissions
France has set itself the goal of achieving carbon neutrality by 20501, and transport is the main sector emitting them. Before the Covid crisis, which severely disrupted the sector, it accounted for 31% of the country’s greenhouse gas (GHG) emissions in 2019. This figure only considers direct emissions from vehicles on the national level, excluding international transport2.
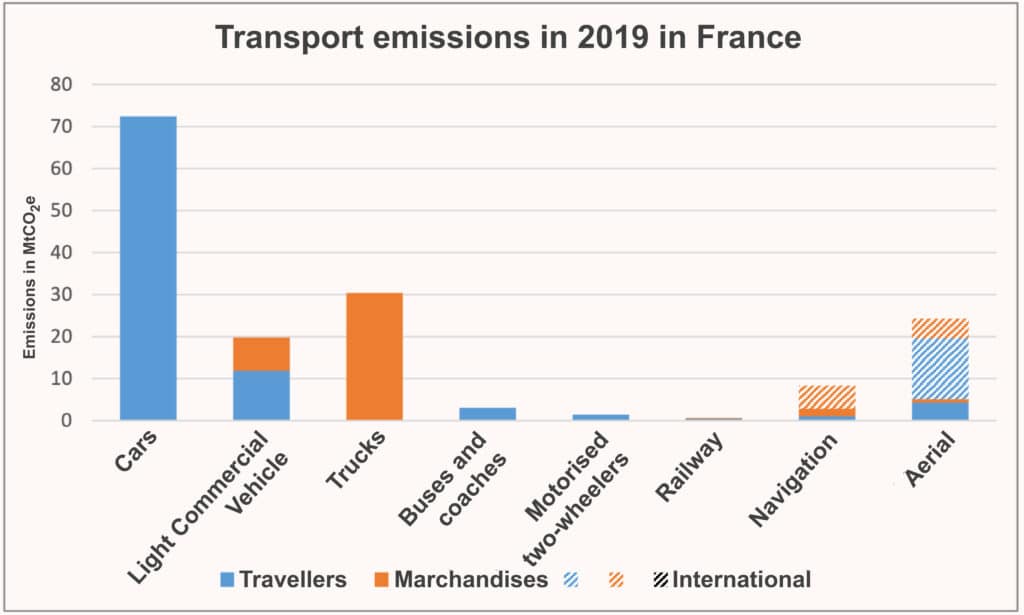
Although it is not always easy to make a precise distinction between passenger and freight transport in the statistics, freight accounts for almost a third of transport emissions – around 10% of total French emissions3. Taking into account international transport, freight transport emissions are dominated by road transport, with heavy goods vehicles in first place (60%), followed by light commercial vehicles (LCVs; 16%), then shipping (14%), dominated by international maritime transport, and then air transport (10%)4.
5 levers to decarbonise transport
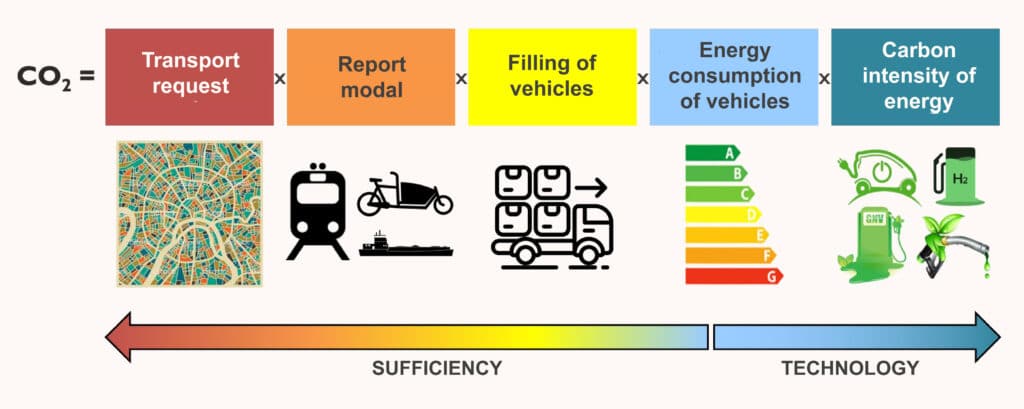
The French national low-carbon strategy (SNBC) cites 5 actions to reduce transport emissions:
- Moderation of transport demand.
- Modal shift towards less emitting modes.
- Improving vehicle occupancy.
- Reducing vehicle energy consumption.
- And finally, the decarbonisation of the energy used.
These levers should make it possible to achieve the objective of complete decarbonisation of domestic freight transport by 2050. This requires the complete withdrawal of oil from heavy goods vehicles, commercial vehicles, freight trains and river transport boats within 27 years. This is a major challenge, given that oil still accounts for more than 90% of the sector’s energy consumption and that the sector’s emissions are struggling to fall at the moment.
Past trajectories dominated by demand
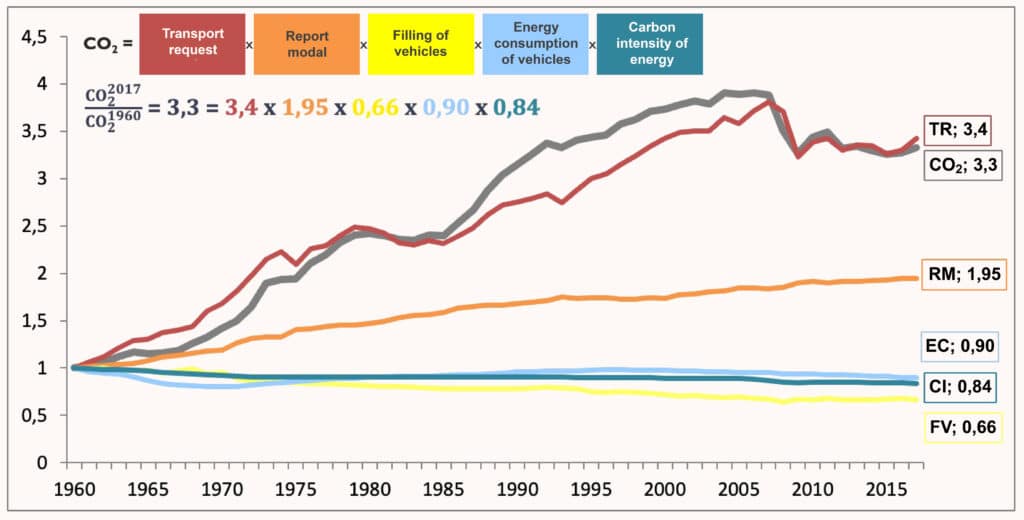
Between 1960 and 2017, CO2 emissions from freight transport increased 3.3 times. It is possible to break down this evolution into 5 explanatory factors5. It appears that transport demand was the main factor explaining the upward (and sometimes downward) trend in emissions. Demand is measured in tonne-kilometres and has increased both because of the increase in the volume of goods to be transported and the increase in the average distance travelled. Overall, demand has increased by a factor of 3.4, with periods of decline following major economic crises (oil shocks, 2008 crisis etc.).
Between 1960 and 2017, CO2 emissions from freight transport increased 3.3 times.
This increase in demand has been driven by road transport, which has seen its modal share rise from 34% in 1960 to around 88% since the mid-2000s, to the detriment of rail and waterways6. The modal shift factor has thus had a strong upward impact on emissions (multiplied by 1.95).
The last three factors have been decreasing. The average vehicle load has improved for all modes, with a shift to higher capacity trucks, trains, and ships (factor of 0.66, with an impact of ‑34% on emissions). The greater weight of these vehicles may have limited the gains in energy consumption per kilometre travelled, which nevertheless amounted to ‑10% over the period. Finally, the carbon intensity of the energy used improved slightly (-16%), mainly due to the development of biofuels at the end of the 2000s, a decrease that appears to be rather artificial when we look at the complete life cycle analysis of their production7.
These major trends were similar in other European countries8. The predominance of demand in the evolution of emissions, the major role of road transport, as well as insufficient gains in the organisation of logistics and technical progress to significantly reduce emissions in recent years are all evident.
The potential of the 5 levers by 2050
The decomposition of emissions into five factors can also be used to study the potential of the different levers in achieving the climate objectives. This is summarised in the graph below, with the contribution of the five levers for the SNBC by 2050 compared with other scenarios published up to 2019 and the ADEME Transition(s) 2050 scenarios.
Demand was projected to increase by 40% by 2050 in the SNBC published in 2020. This is more than the average of the trend scenarios, while other scenarios projected decreases of around ‑30% for the average of the 4 most ambitious scenarios on the lever. Thus, the SNBC appears to be very unambitious in terms of moderating transport demand, despite the importance of this factor up to now. However, the reduction in demand can also facilitate a significant modal shift from road to rail and, secondarily, to waterways, exceeding the ‑20% potential reduction in emissions.
The trend is still towards a slight improvement in the average vehicle occupancy rate, but the margins for progress in relation to the trend appear to be more limited here than for the two previous levers: the SNBC was particularly ambitious here. The reductions in vehicle consumption approach ‑20% by 2050 in the average of the trend scenarios and can approach or even exceed a division by 2 in the most optimistic scenarios. These efficiency gains are obtained in part through the hybridisation or electrification of vehicles, or sometimes also through very optimistic assumptions on the progress of thermal engines, as is the case in the SNBC9.
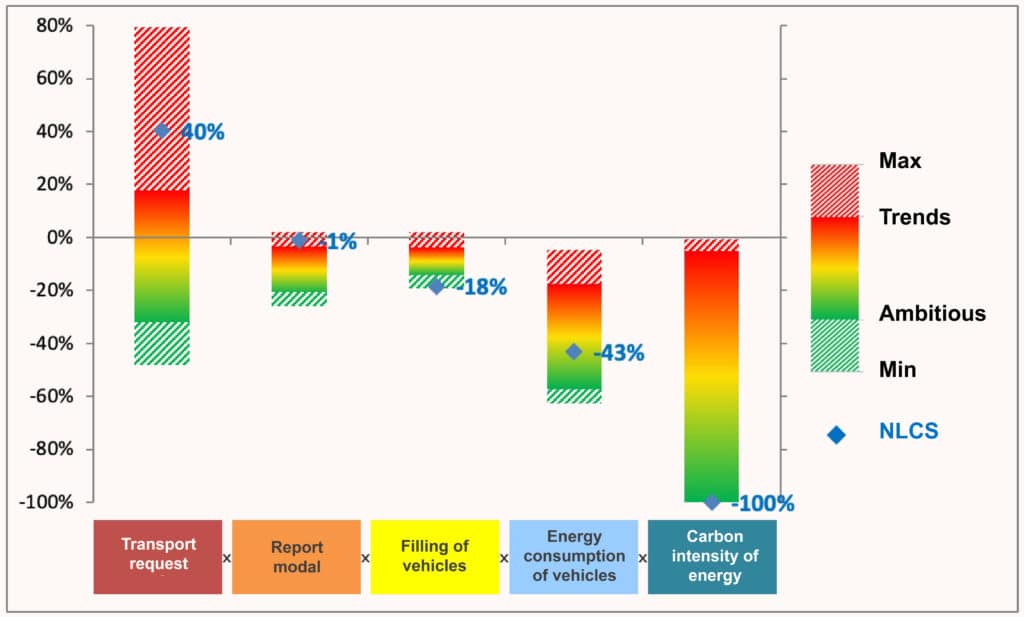
Finally, decarbonisation appears limited in the trend scenarios, and very strong in the carbon neutrality scenarios (especially the most optimistic ones on technological developments). This significant difference shows how far we must go to get out of a trend that is far from being in line with our climate objectives.
Decarbonisation more difficult than for passengers?
Passenger and freight transport have similarities in terms of decarbonisation issues: they often share the same infrastructure (for transport modes and energy), can call on the same five levers, have had similar trends in their past evolution, and are dominated by road transport in terms of practices and emissions.
However, beyond what is transported (people or goods), a major difference also concerns the main players in the sector, which are more dominated by companies for goods transport. Optimisation of transport costs and certain decarbonisation levers have already been more pronounced in this sector than for passengers, limiting, for example, the gains to be expected from the filling of vehicles (unlike cars, which are very little filled on average). The scope for reducing vehicle energy consumption is also less than for passengers. Finally, the decarbonisation of vehicle fleets is much less well underway for heavy goods vehicles than for cars, with still considerable uncertainty as to which engine(s) will be preferred in the future.
There is therefore a great risk that the share of freight transport in transport emissions and even in national emissions will increase in the coming years and decades if a break with current trends is not made.
This article is the first in a series of 4 articles on the energy transition of freight transport. After this introductory article, the following three articles will discuss technological developments to decarbonise freight transport, the potential, and difficulties of using the modal shift lever, and finally the issue of demand moderation.