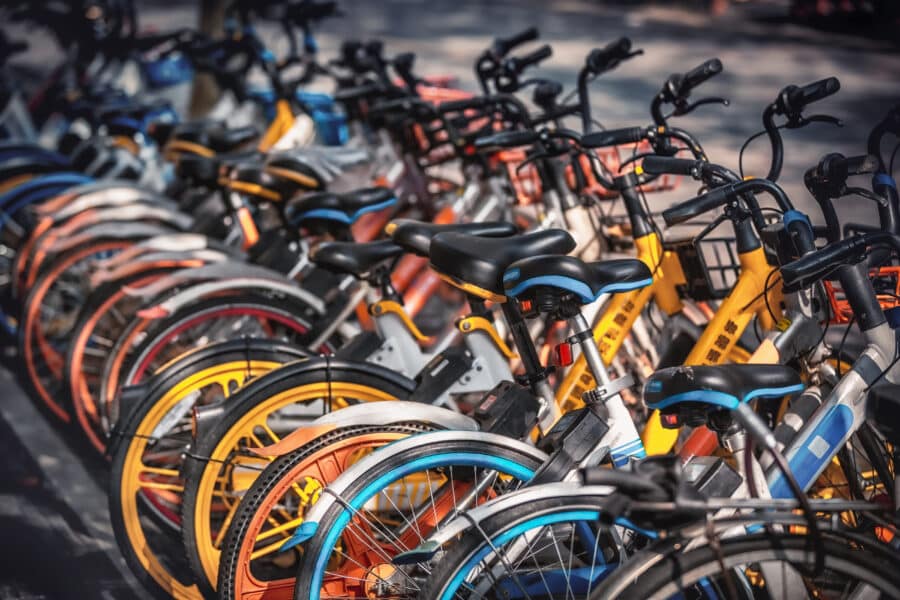

Electrically-assisted bicycles (EABs) are on a roll: in 2020, 20% of bicycles sold in Europe (4.5 million) were electric, and this figure is expected to rise to 55% by 20301. So, let’s get to the heart of the matter: is it a problem for the climate?
Compared with many other modes of transport… Of course not! In France, the carbon footprint of an electric bicycle averages 13 grams of CO2 equivalent (CO2e) per kilometre travelled, if the vehicle is used for 20,000 km. This figure represents the entire life cycle of the bicycle: manufacture, use, maintenance and end of life. All the greenhouse gases (GHGs) emitted are included – which is why we talk about CO2 equivalent. The impact of an EAB is slightly greater than that of a muscle bike, which has a carbon footprint of 10 to 12g of CO2e/km travelled.
But these forms of transport are among the most efficient in terms of all environmental factors. In France, the carbon footprint of an electrified train is estimated at around 35g of CO2e/km travelled per passenger. This rises to 60–75g of CO2e/km travelled for an electric city car. Internal combustion cars and aeroplanes exceed the 100g CO2e/km mark. Only walking (1 to 2g of CO2e/km travelled) and the Paris metro and RER (8 to 10g of CO2e/km travelled) are more efficient than cycling. It is estimated that buying and using an electric bicycle in France has a better carbon footprint than using a combustion-powered car in the city, as long as the bicycle is used for more than 1,000 km before being recycled.
Can’t the good results achieved by electric bikes in France be explained by our low-carbon electricity mix?
When I worked on this subject 7 years ago, I found that the footprint associated with the use of electric micro-mobility was multiplied by three in China. Since then, the Chinese electricity mix has been decarbonised and the difference is smaller, but still significant. In Germany, electricity production currently emits 10 times more greenhouse gases than in France. But in the end, the impact on the total carbon footprint of an ECV is moderate, because an ECV consumes little electricity, while its manufacture accounts for the majority of GHG emissions over its life cycle. The total carbon footprint climbs from 13g CO2e/km travelled in France to 17g CO2e/km travelled in Germany.
Why is the manufacture of ECVs the biggest source of GHG emissions over their entire life cycle?
Manufacturing accounts for 94% of the total carbon footprint of an ECV driven 20,000 km in France2. For a 20kg aluminium bicycle (excluding electric assistance) manufactured in China, the production of the frame emits 181kg of CO2e. Manufacturing the battery emits 20 kg of CO2e and the motor 37 kg of CO2e. The biggest source of greenhouse gas emissions from an ECV is therefore linked to the manufacture of the frame. Aluminium is the culprit. China is the world’s leading producer of refined aluminium: the country produces almost half the world’s aluminium3. Even though China is reducing the carbon footprint of its electricity mix, aluminium refining is still a major emitter of greenhouse gases. This is the biggest contributor to the carbon footprint of an ECV. Assembly really does have a limited impact, so a “made in France” bike is of little interest in terms of carbon footprint unless the metal in the frame is refined in a country where the electricity mix is low in carbon (e.g. French, Quebecois or Icelandic aluminium).

The impact of batteries therefore seems negligible…Batteries get a bad press because of electric cars. But an electric car carries several hundred kilos of batteries. The battery in an electric bicycle weighs just a few kilos. The greenhouse gas emissions generated by these batteries are comparatively low.
However, they are difficult to assess precisely. We analysed around thirty publications on lithium-ion batteries, and the carbon footprint per kWh varies by a factor of 10.There is a lot of uncertainty about the conditions under which the metals are extracted from the mine and refined. It is difficult to obtain reliable industrial data. That doesn’t change the fact that frames account for the largest share of emissions. What’s more, we can consider that the most fuel-efficient EAB is a muscle bike – without electricity – that is already in use, and that we are going to fit with an electric assistance system. This is also known as retrofitting. It’s an extremely interesting solution for avoiding the need to build a new frame.
What are the other sources of GHG emissions from an ECV?
That depends on the country. Maintenance accounts for around 8% of GHG emissions over the entire life cycle of a bicycle in France. Electricity consumption averages 1 kWh per 100 km, i.e. 0.5 g of CO2e/km travelled in France (i.e. around 4% of total EAB emissions) or 5 g of CO2e/km in Germany (i.e. 29% of total EAB emissions).It depends, of course, on the bike, the user, the topography and changes in the electricity mix.
As far as end-of-life is concerned, recycling batteries and materials can reduce the carbon footprint by 6% in France. Unfortunately, less than 8% of batteries in ECBs are currently recycled.
Is it possible to reduce the carbon footprint of ECVs?
The various levers mentioned above – more recycling and the retrofitting of muscle bikes – are virtuous practices in this respect. The longer a bike lasts, the smaller its carbon footprint per kilometre travelled.
As the frame is the element that has the biggest impact, we then need to work on it. For example, it is possible to turn to alternative aluminium producers, such as Quebec. Using alternative materials such as steel and wood is also an interesting lever. Finally, a great deal of research is being carried out on batteries. With colleagues, we are currently assessing the impact of using other types of batteries (such as sodium-ion batteries and solid electrolyte batteries) on the carbon footprint of electric vehicles. The results are very encouraging.